35 Cool Charts And Graphs From ‘Information Is Beautiful’ That’ll Change How You See The World
I fall for a good graph every time, especially the kind that makes a weirdly specific point in the most satisfying way. The folks at Information Is Beautiful didn’t make these cool graphs and charts, but they did dig them up from all corners of the internet and curate them like a museum for data nerds.
These visuals are funny, clever, surprisingly deep, or just plain cool. I picked out some of my favorites from their recent roundups. A few made me laugh. A few made me rethink how I see the world.
Follow “Information is Beautiful: Instagram | Facebook | Twitter | Website
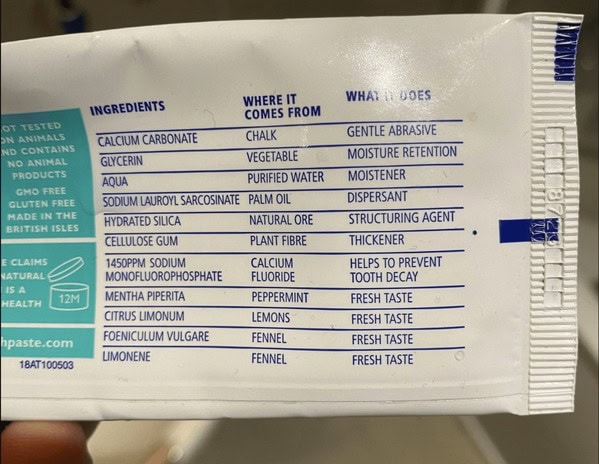
1. “Truthpaste! Love This Labelling – Let’s Roll It Out Across All Products”
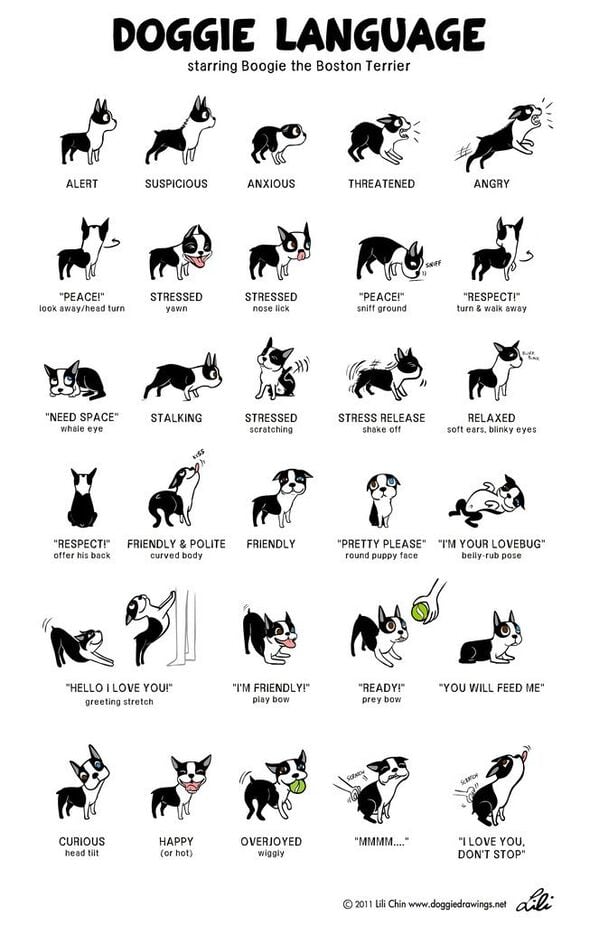
2. “Lovely Chart Of Doggie Body Language”
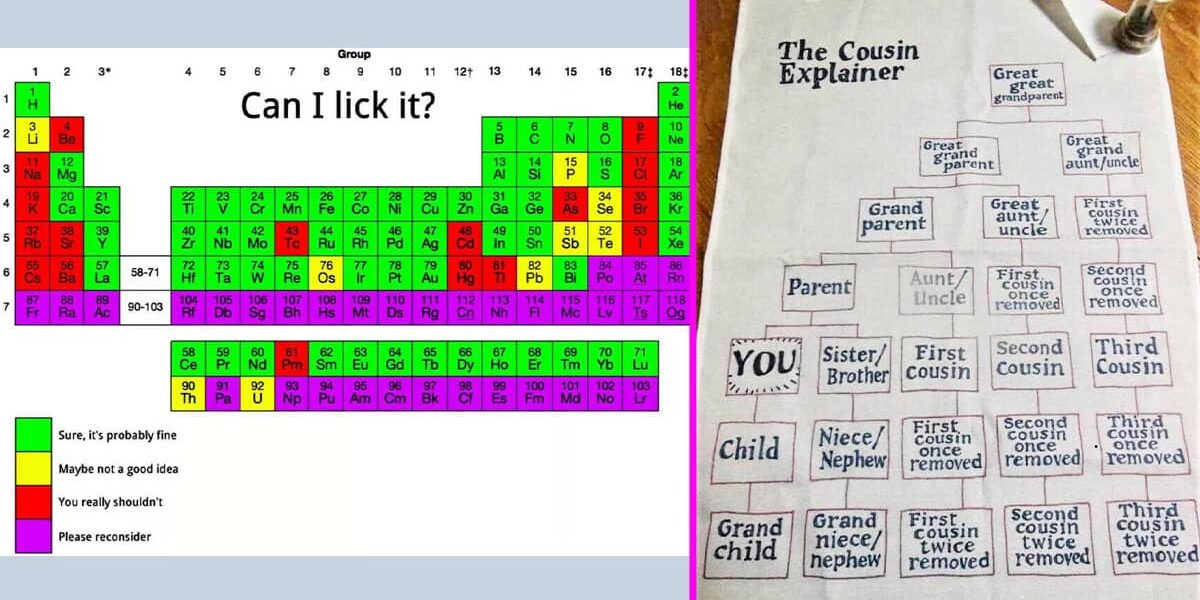
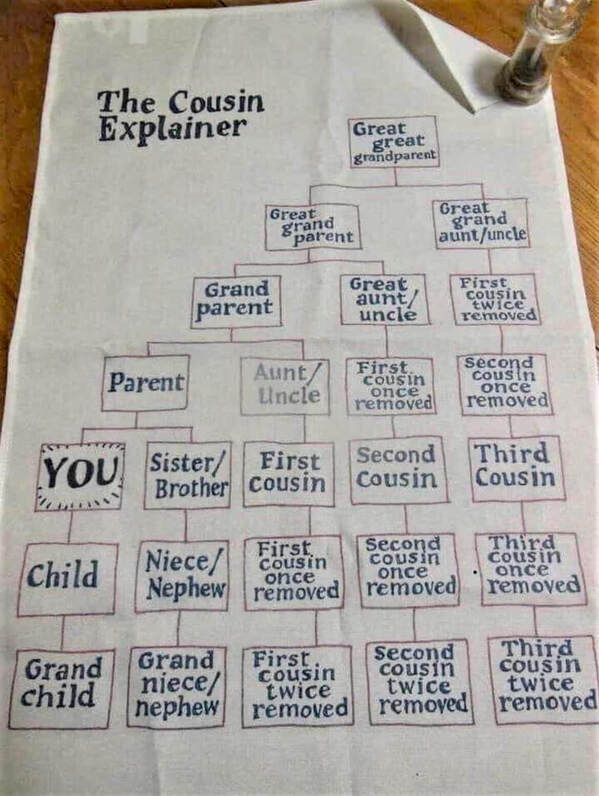
3. “Wait, Who Is My Third Cousin Twice Removed? Oh”
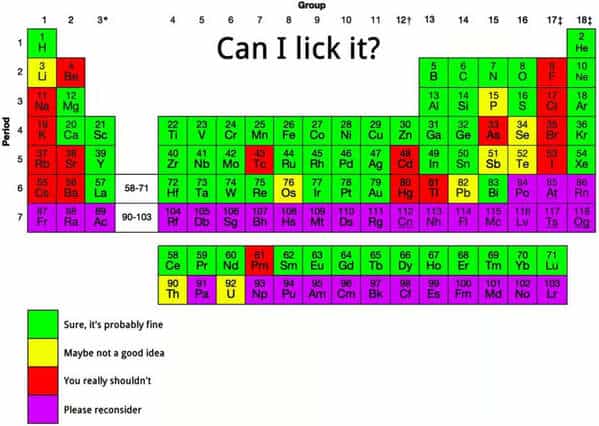
4. “Periodic Table By Lickability”
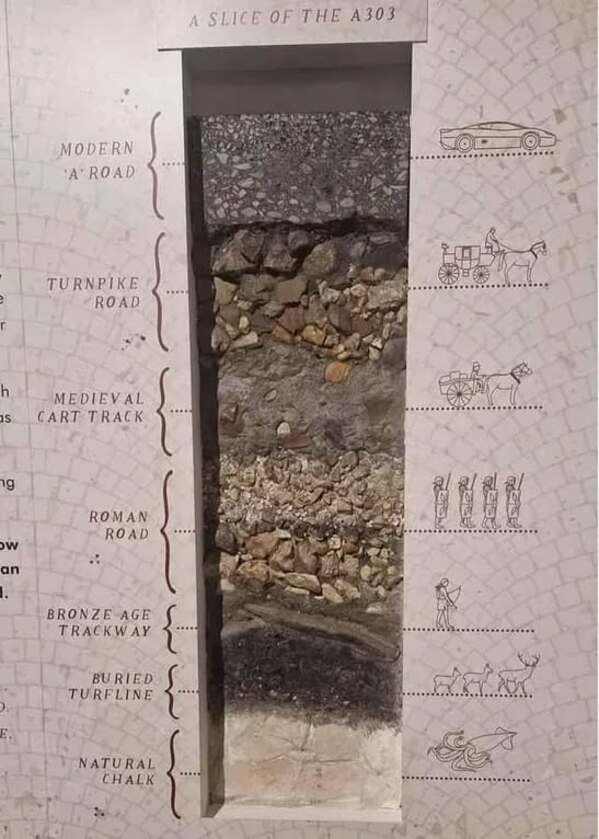
5. “Revealing Cross Section Of A Road In England”
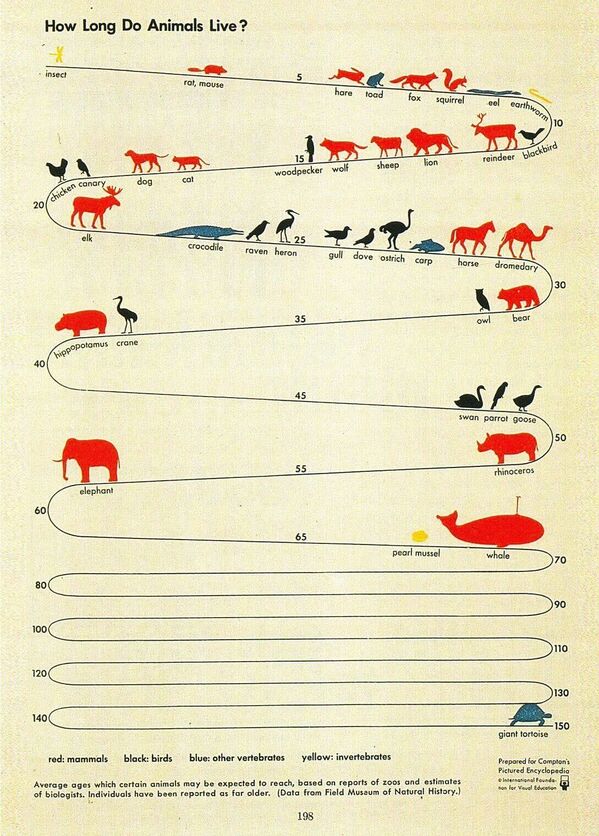
6. “Classic Isotype Infographic From The 1940s”
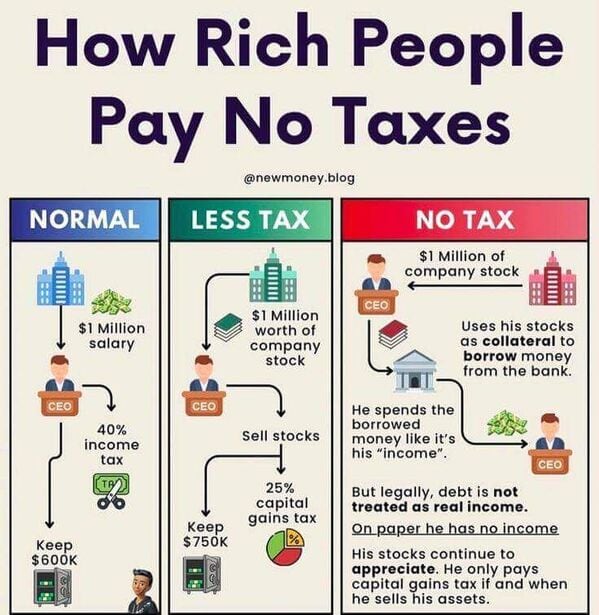
7. “How Rich People Avoid Paying Tax”
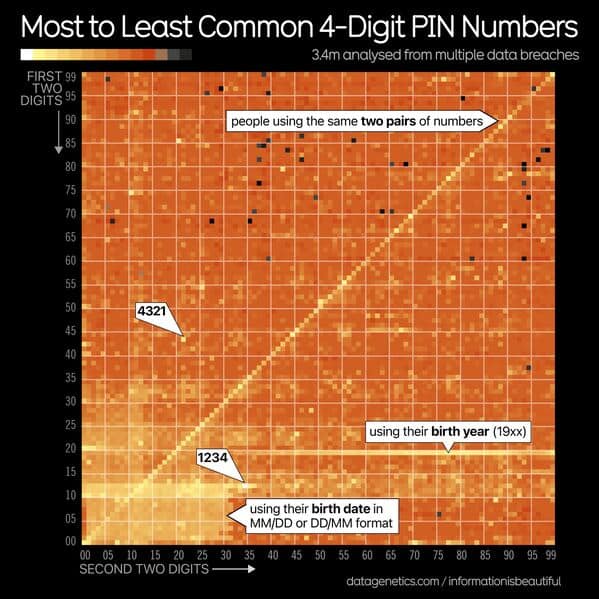
8. “Warning! This Image May Trigger Pinsecurity. From An Analysis Of 3.4m Pin Code Leaked From Several Data Breaches”
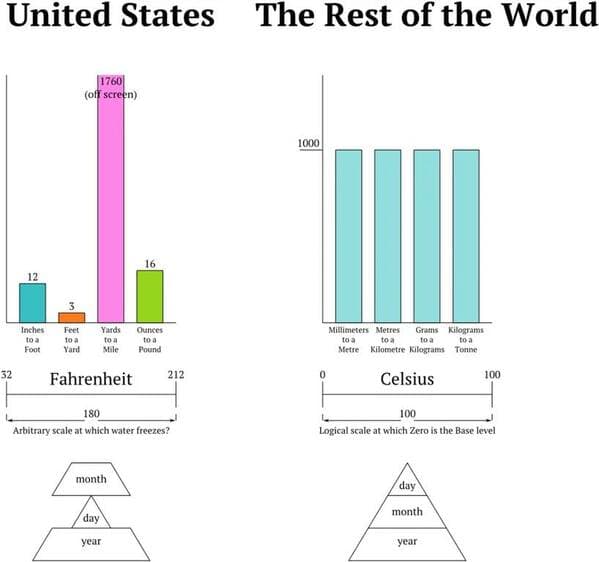
9. “Measurement Unit Differences Between The U.S.A. And Most Of The World”
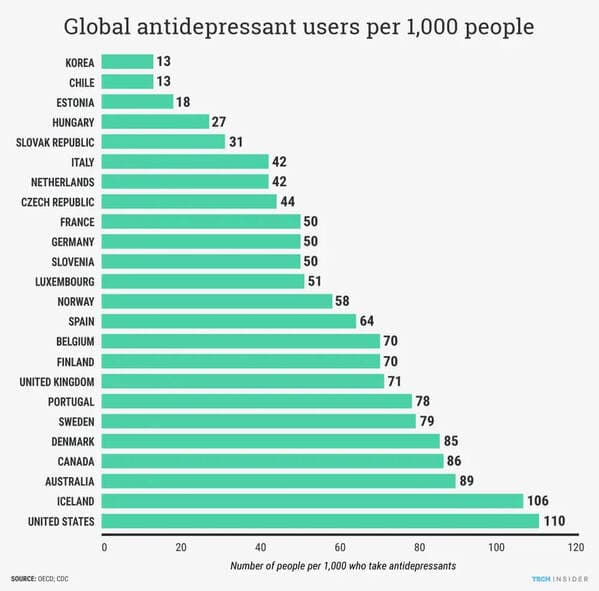
10. “Global Antidepressant Use”
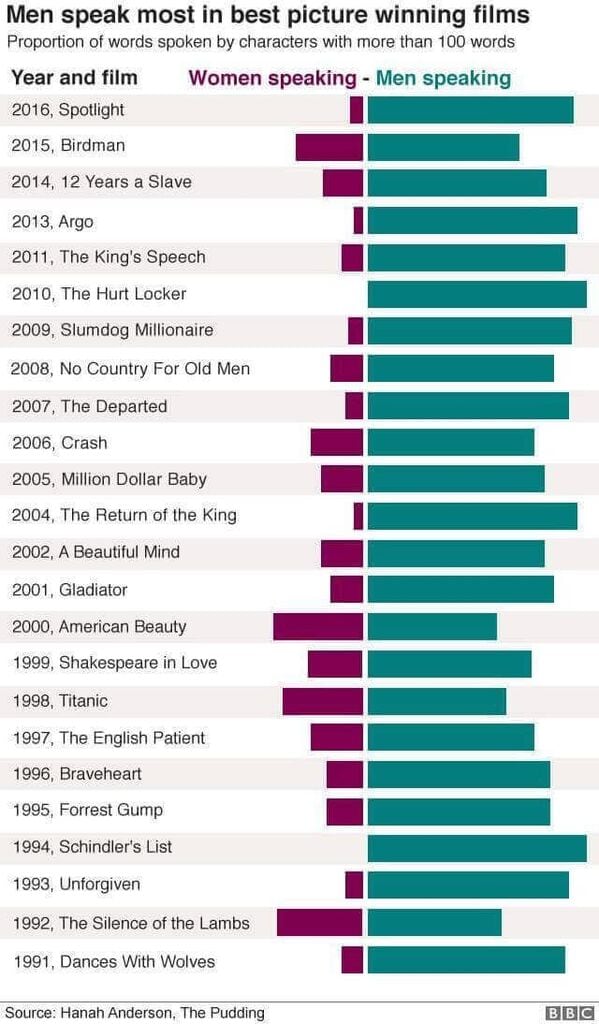
11. “Telling. Quantity Of Male Versus Female Dialogue In Best Picture Films Of Recent Decades”
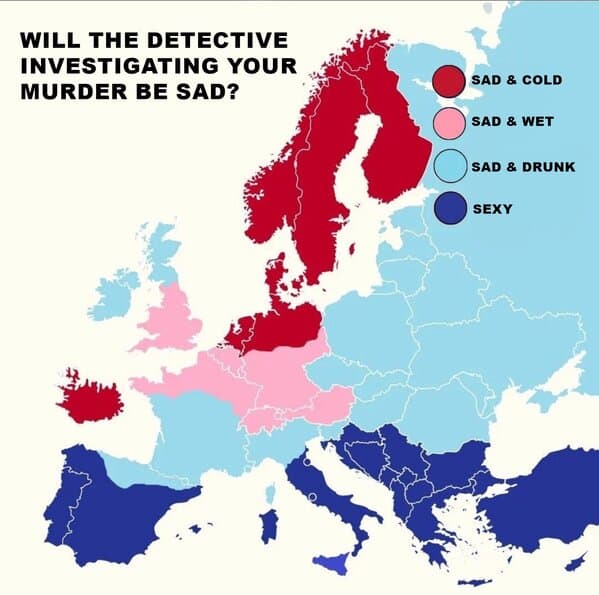
12. “What Mood Will Your TV Detective Be In?”
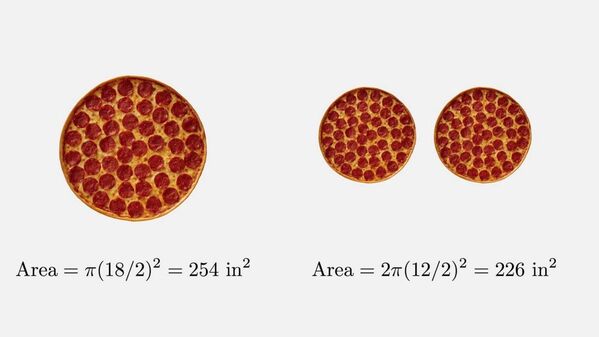
13. “One 18 Inch Pizza Has ‘More Pizza’ Than 2 X 12 Inch Pizzas!”
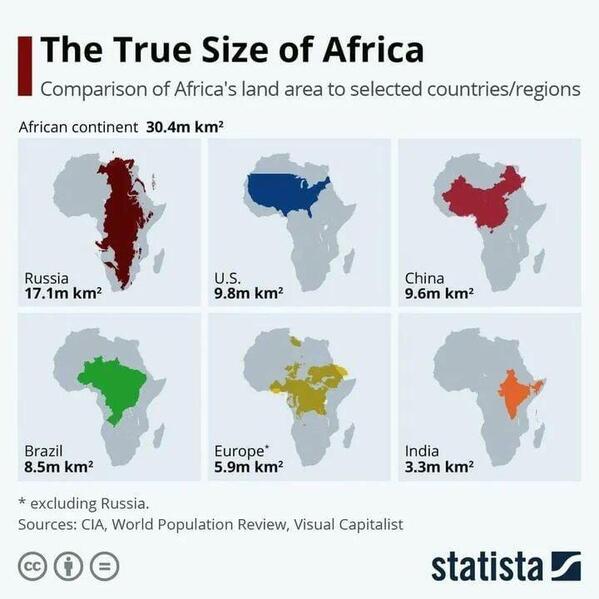
14. “Africa Is Big”
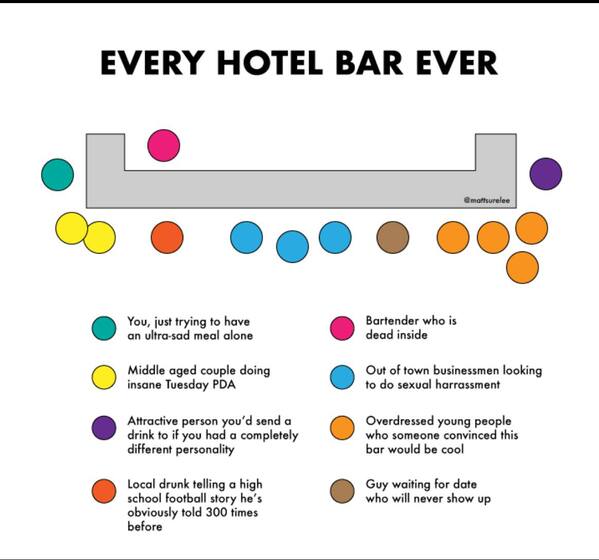
15. “Every Hotel Bar Ever”
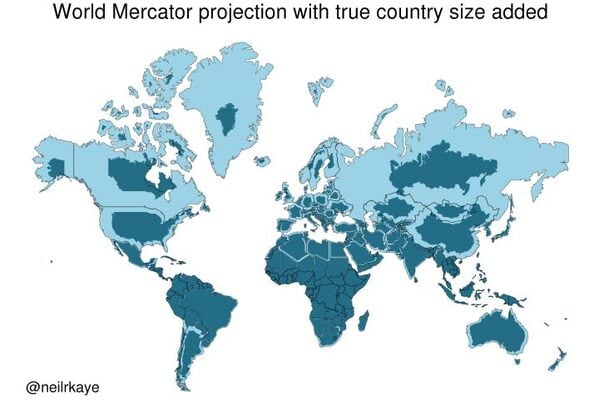
16. “Yet Another Reason To Tut At The Mercator Map Projection”
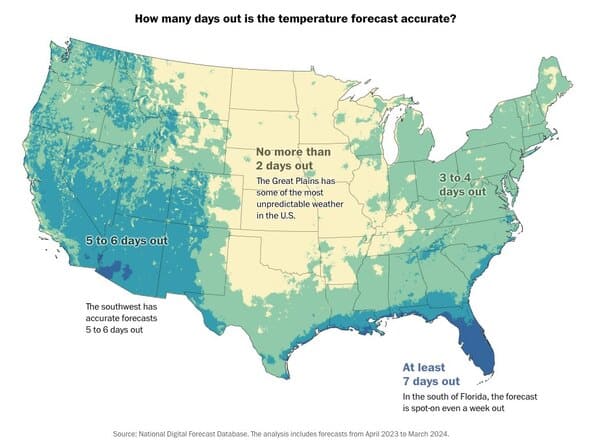
17. “How Reliable Is The Us Weather Temperature Forecast? Didn’t Know That About Florida”
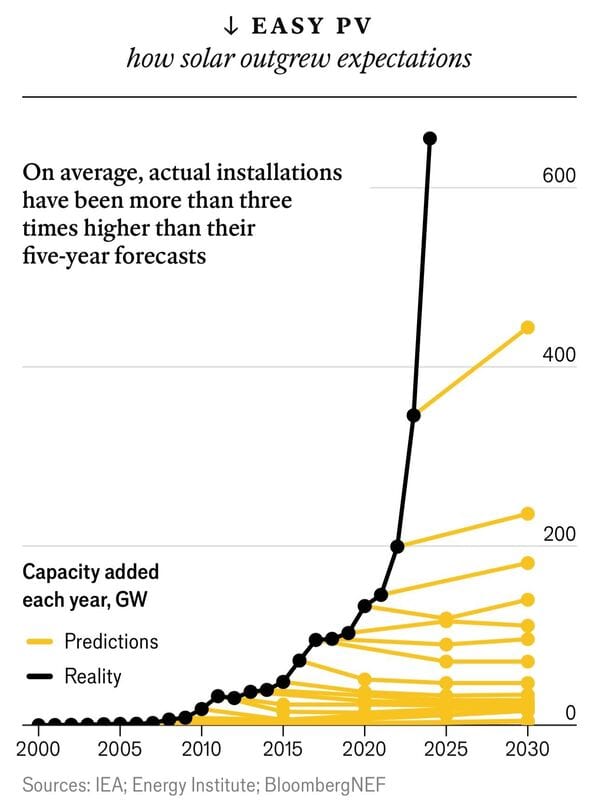
18. “The World’s Solar Capacity Reached 1,419 Gigawatts In 2023, Way Beyond Any Predictions. 1 Gigawatt = Power For A Medium Sized City”
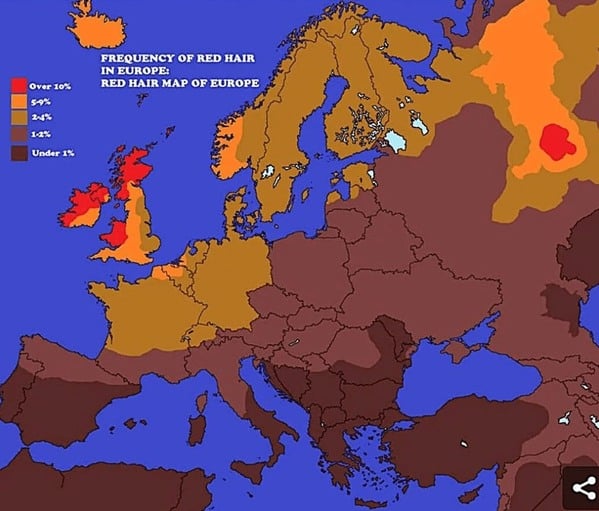
19. “Frequency Of Red Hair In Europe”
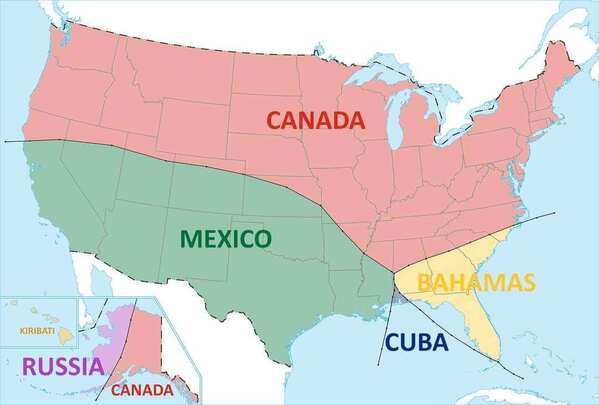
20. “The Nearest Other Country…”
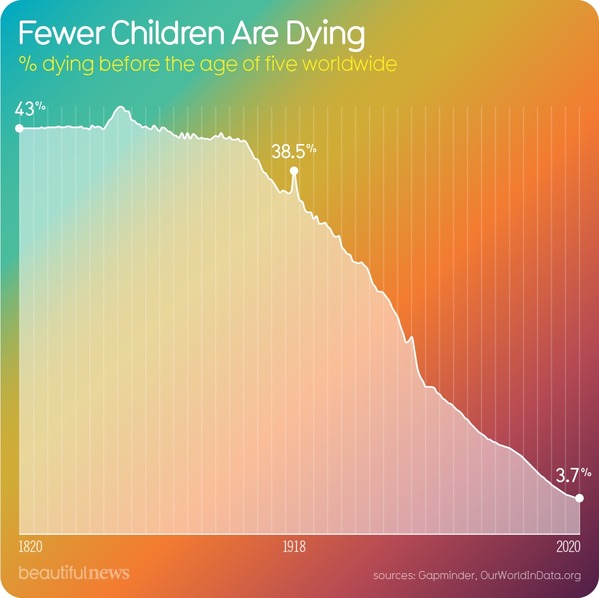
21. “One Of Humanity’s Greatest Achievements”
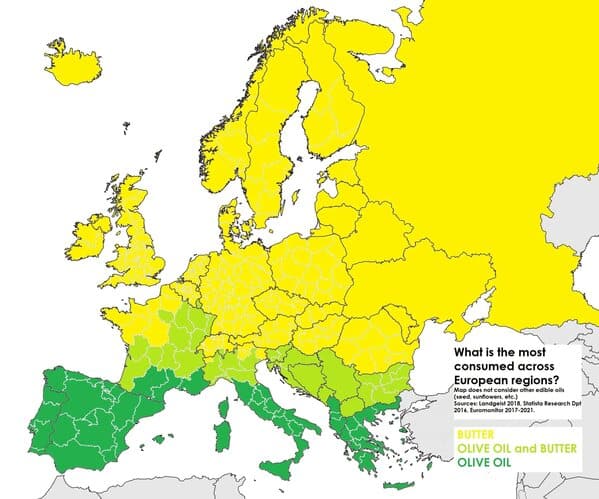
22. “Ever Heard Of The Butter Line?”
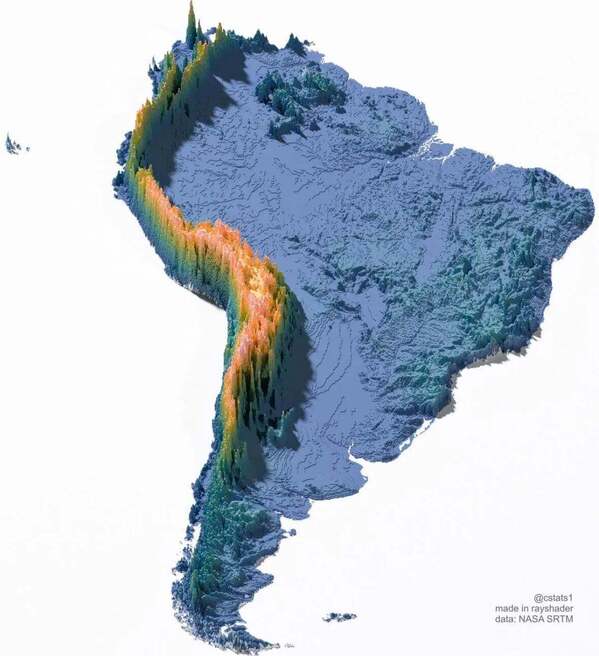
23. “Beautiful Elevation Art”
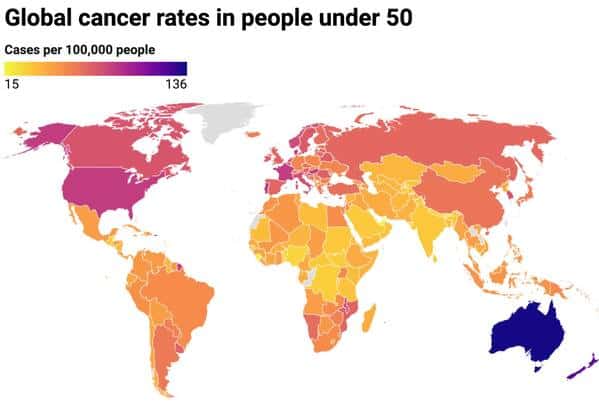
24. “Woah Australia – Global Cancer Rates In People Under 50”
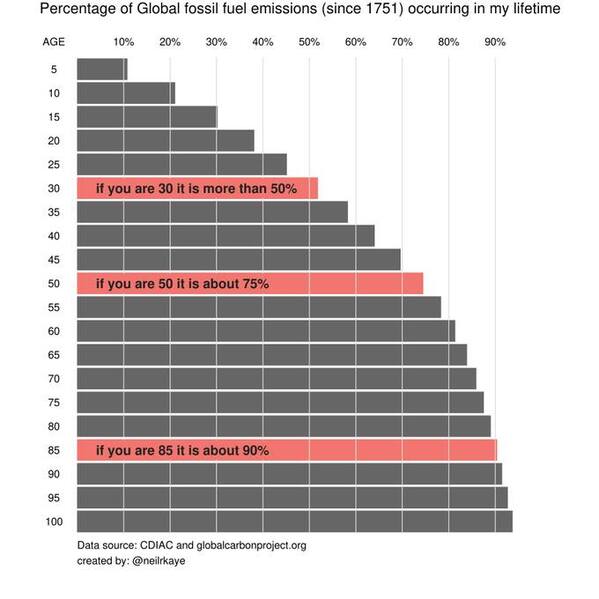
25. “If You’re Aged 30 Or More, Then 50% Of All Human Fossil Fuel Emissions Happened During Your Lifetime”
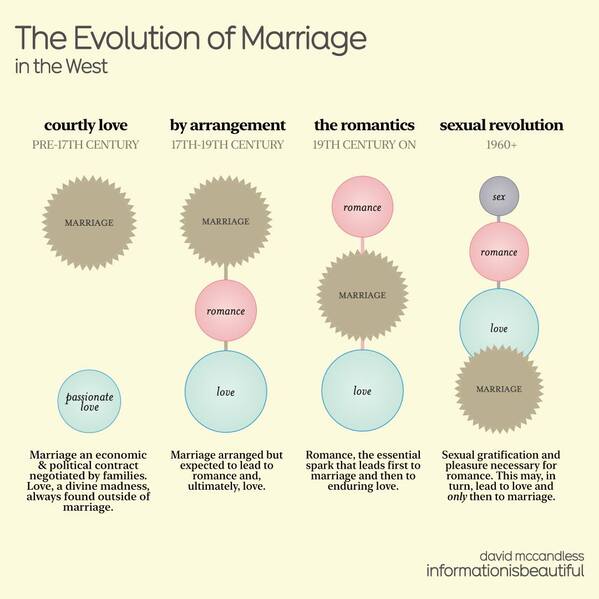
26. “How The Concept Of Marriage Has Changed Across Centuries”
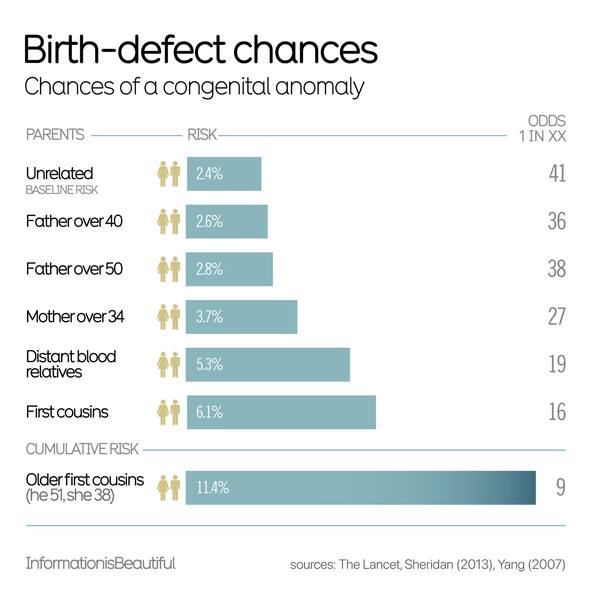
27. “We Were Curious”
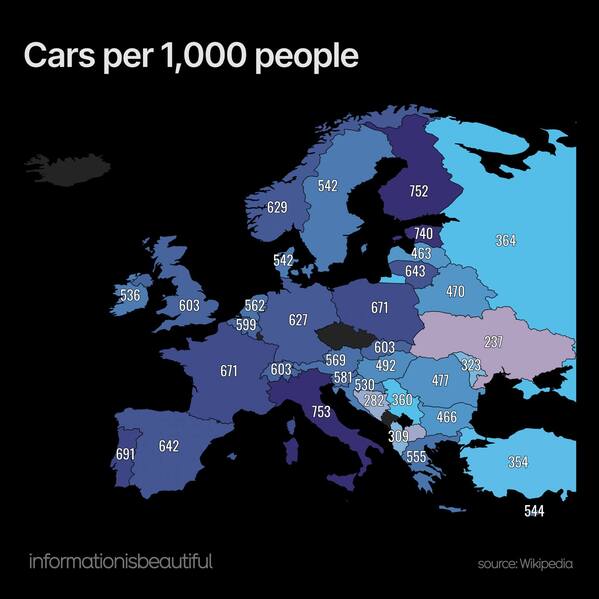
28. “Cars Per 1,000 Inhabitants”
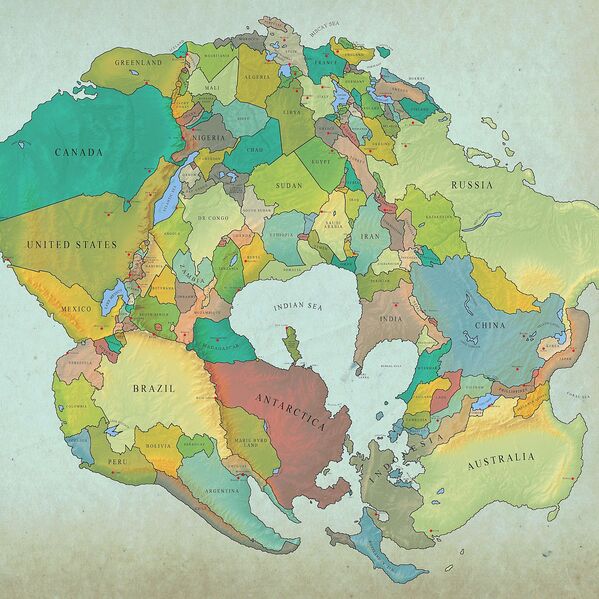
29. “How The World Will Look In 250 Million Years”
30. “Some Interesting Variations Here”
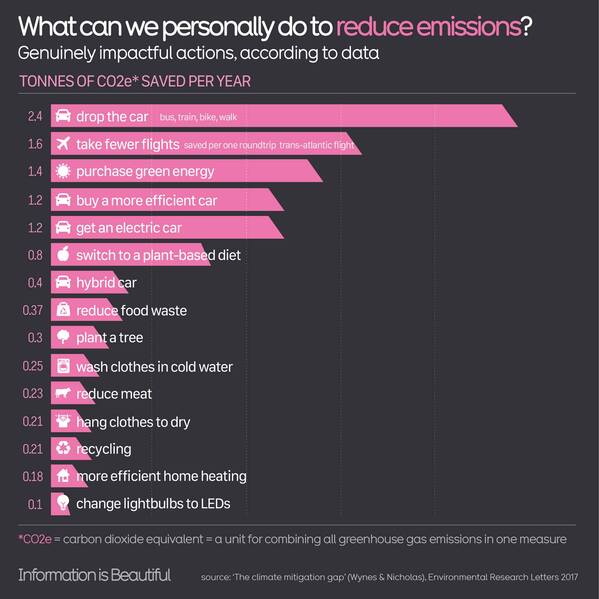
31. “What’s Actually Worth Doing To Make A Climate Difference, According To Data?”
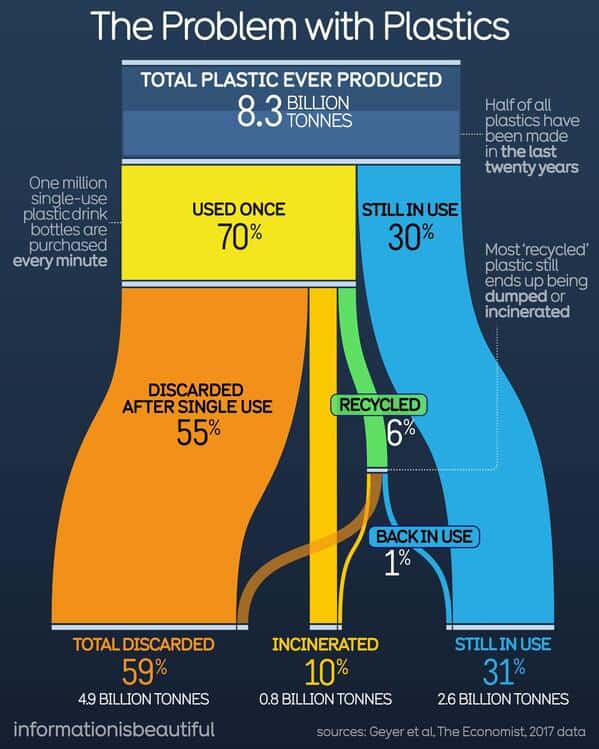
32. “Guess What % Of Plastics Have Been Recycled”
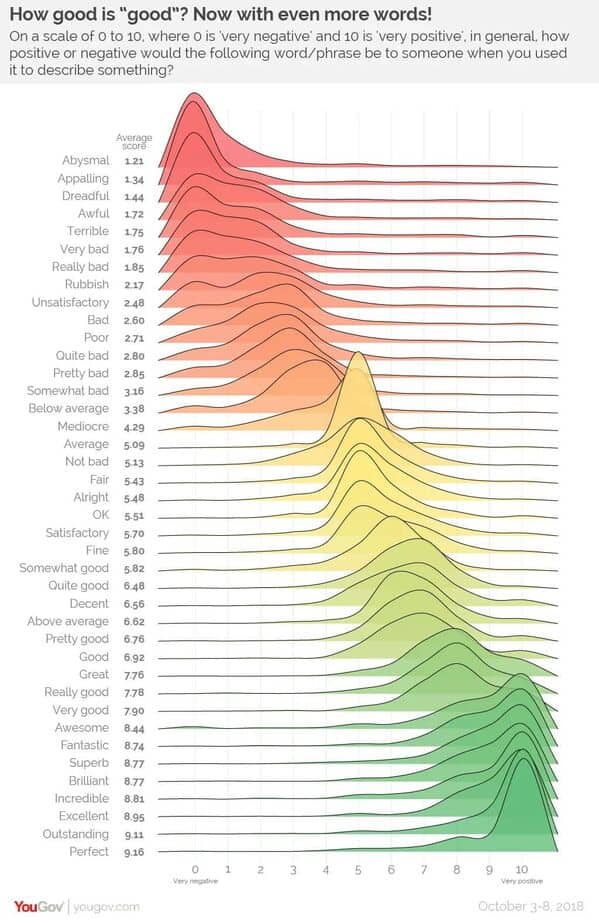
33. “Rubbish? Fine? Brilliant? British Superlatives Graded And Ranked”
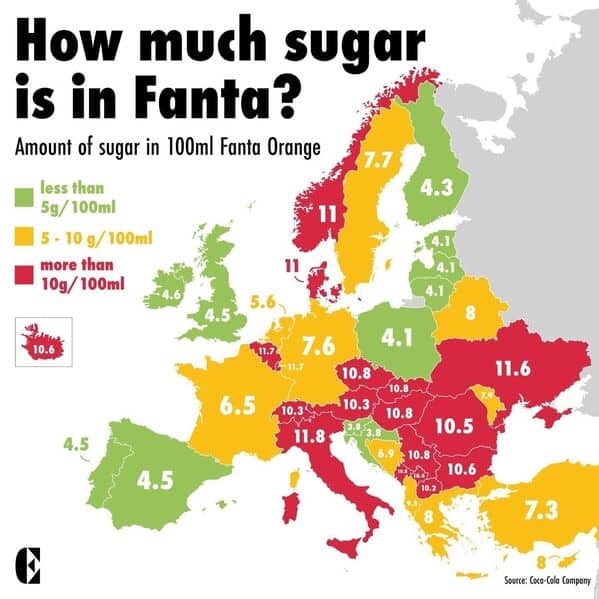
34. “Sweet Teeth In The East. How Much Sugar In Fanta”
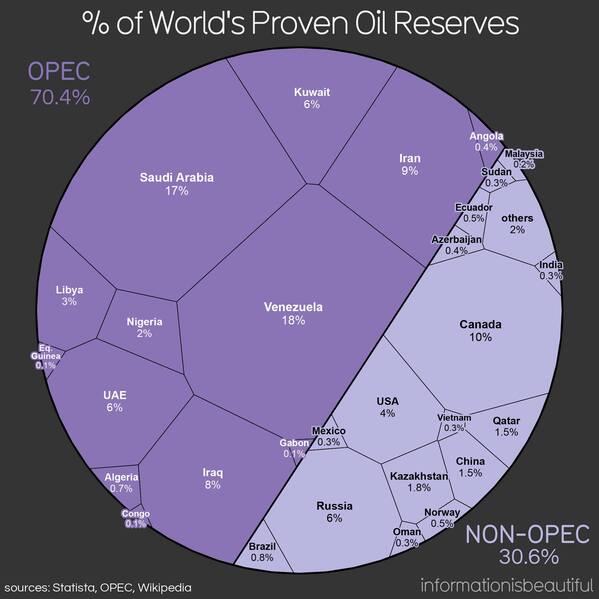
35. “Oil”
<